

Power BI and Excel: Combining the Best of Both Worlds
Table of Contents
In today’s data-driven world, businesses and analysts rely heavily on tools that allow them to process, analyze, and visualize data efficiently. Two of the most powerful and widely used tools for data analysis and business intelligence are Microsoft Excel and Power BI. While Excel has been a cornerstone of data analysis for decades, Power BI has emerged as a game-changer for real-time business intelligence and interactive data visualization.
Rather than viewing Excel and Power BI as competing tools, professionals can leverage their combined strengths to enhance data analysis capabilities, improve collaboration, and gain deeper insights. In this article, we will explore how to integrate these two tools effectively and maximize their potential.
Understanding Excel and Power BI
Excel: A Staple in Data Analysis
Launched in 1985, Microsoft Excel has become the gold standard for spreadsheet-based data management. It is widely used across industries for:
- Data entry and organization
- Statistical analysis and financial modeling
- Custom formula calculations
- Pivot tables and charts
- Data automation using VBA (Visual Basic for Applications)
- Basic business intelligence through Power Query and Power Pivot
Despite its extensive functionality, Excel has limitations when handling large datasets, real-time reporting, and collaborative analytics.
Power BI: A Modern Business Intelligence Tool
Introduced in 2014, Microsoft Power BI is a powerful business intelligence and data visualization tool that helps organizations transform raw data into actionable insights. Power BI consists of three main components:
- Power BI Desktop – for report creation and data modeling
- Power BI Service – for cloud-based sharing and collaboration
- Power BI Mobile – for on-the-go data analysis
Key features of Power BI include:
- Advanced data visualizations
- Real-time data integration
- AI-driven analytics
- Secure role-based access
- Seamless integration with multiple data sources
- Scheduled data refreshes
While Power BI is excellent for interactive dashboards and automated reporting, it is not as flexible as Excel for complex ad-hoc analysis and custom calculations.
Key Similarities Between Excel and Power BI
Despite their differences, Excel and Power BI share several common features:
- Microsoft Ecosystem Integration – Both tools seamlessly integrate with Microsoft 365, SharePoint, and Teams.
- Power Query – A powerful data transformation engine available in both Excel and Power BI.
- Data Connectivity – Both support connections to databases, cloud services, and APIs.
- Data Visualization – Excel and Power BI offer charts, graphs, and other visual elements for data representation.
- Formula-Based Analysis – Both tools support DAX (Data Analysis Expressions) and M Query for advanced calculations.
Key Differences Between Excel and Power BI
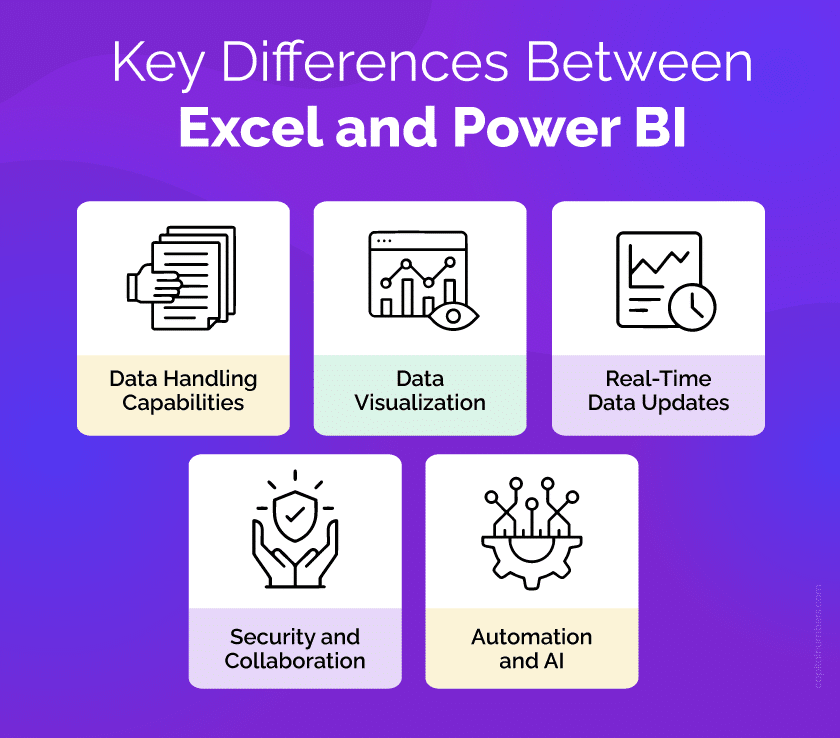
1. Data Handling Capabilities
- Excel: Can manage up to 1 million rows per worksheet. Performance can slow down significantly with large datasets.
- Power BI: Can handle millions of rows efficiently using cloud-based or in-memory processing.
2. Data Visualization
- Excel: Provides basic charts, pivot tables, and conditional formatting.
- Power BI: Offers interactive dashboards, drill-through reports, AI-powered visuals (Q&A, Decomposition Tree), and marketplace visuals.
3. Real-Time Data Updates
- Excel: Requires manual refreshes for updated data.
- Power BI: Supports automated data refreshes on a scheduled basis.
4. Security and Collaboration
- Excel: Basic security features like password protection; limited collaborative capabilities.
- Power BI: Role-based security and centralized access control for enterprise-wide collaboration.
5. Automation and AI
- Excel: Uses VBA macros for automation.
- Power BI: Supports AI-powered insights and natural language processing.
Best Use Cases for Excel and Power BI
| Scenario | Best Tool |
|---|---|
| Ad-hoc financial modeling | Excel |
| Real-time business monitoring | Power BI |
| Small-scale data analysis | Excel |
| Enterprise-wide reporting | Power BI |
| Custom calculations and formula-based data processing | Excel |
| Interactive dashboards for decision-making | Power BI |
| Data entry and spreadsheet organization | Excel |
| Handling large datasets and multiple data sources | Power BI |
Combining Power BI and Excel for Maximum Efficiency
Rather than choosing one tool over the other, businesses can leverage both tools strategically. Here’s how:
1. Use Excel for Data Preparation, Then Import into Power BI
Excel is ideal for raw data collection and pre-processing. Once data is cleaned, it can be imported into Power BI for advanced analytics and visualization.
Steps to Import Excel Data into Power BI:
- Open Power BI Desktop.
- Click Home → Get Data → Excel.
- Select your Excel file and import the relevant data tables.
- Use Power Query to transform data if needed.
- Create dashboards and publish reports.
2. Embed Power BI Reports in Excel
Power BI reports can be embedded within Excel using the Power BI Publisher for Excel add-in, allowing users to access interactive dashboards directly in Excel.
3. Automate Data Refresh with Power Automate
Use Power Automate to schedule automated Excel-to-Power BI data refreshes, ensuring real-time insights without manual intervention.
4. Leverage Power BI’s AI-Driven Insights for Advanced Excel Analysis
Power BI’s AI-powered visualizations (like the Smart Narrative feature) can provide automated insights, which can then be exported back to Excel for further manipulation.
5. Use Excel Pivot Tables on Power BI Datasets
Power BI datasets can be analyzed in Excel using Pivot Tables, allowing Excel users to work with up-to-date Power BI data without exporting reports.
Steps to Connect Power BI to Excel Pivot Tables:
- Open Excel.
- Click Data → Get Data → From Power BI Dataset.
- Select the dataset you want to analyze.
- Create Pivot Tables and charts in Excel using live Power BI data.
Real-World Example: Sales Performance Analysis
A retail company wants to analyze sales performance across multiple locations. They use Excel to collect sales transactions from various stores. However, analyzing trends and sharing reports in Excel is time-consuming.
By integrating Power BI, they can:
- Automatically import and update sales data from Excel files.
- Create interactive dashboards showing real-time revenue, sales trends, and stock levels.
- Allow management to access insights from any device.
- Set up role-based access to control who sees specific data.
Power BI Development Services by Capital Numbers.Transform data into insights with custom dashboards, real-time analytics, and AI-powered reports for smarter decision-making.
Get a Free Consultation!
Conclusion
Both Excel and Power BI have unique strengths, and businesses do not need to choose one over the other. Excel remains a powerful tool for ad-hoc analysis, complex calculations, and financial modeling, while Power BI excels in data visualization, real-time analytics, and large-scale reporting.
By integrating the two, businesses can leverage Excel’s flexibility with Power BI’s automation and visualization capabilities—creating a seamless and powerful data analytics ecosystem.

![]()