Optimize WordPress Using Core Web Vitals: Speed Up Your Site
Table of Contents
Websites in recent times need to be faster and more responsive to user interactions. When users visit a web page, requests to load assets on the page can pass through a series of different facets, like loading resources from remote servers, interacting with users by loading dynamic content on the web page, as well as responding to events that have been generated on the page for user interactions.
Study of these facets while a page loads (better known as “loading sequence”) can shed more light on ways to optimize assets on the page so that the loading time could be minimal to enhance user experience. To this end, numerous tools have been developed for checking page loading like PageSpeed Insights, GTMetrix, Debugbear to name a few, that have forayed into the optimization niche. The generated reports on the “page load time” show details on the parameters/metrics for page loading using numerical data so that they can be studied and optimized.
WordPress performance optimization can be discussed considering various scenarios. This article discusses an overall analysis of the main three “Core Web Vitals” metrics (mainly two) and discusses ways to optimize them in general and using WordPress CMS in particular. These are the main metrics, which, if correctly optimized, would reduce page load times and make website loading much faster for a better user experience.
What are Core Web Vitals?
In this article, three pertinent metrics for performance of page load known as “Core Web Vitals” are being considered. These metrics have been proposed by “Google” to provide numerical values for determining page load speed. These metrics have been named “LCP” (Largest Contentful Paint), “CLS” (Cumulative Layout Shift), and “INP” (Interaction To Nextpaint).
“Core Web Vitals” are considered a subset of “Web Vitals” that are also proposed by Google for measuring website loading times. These metrics (LCP, CLS, and INP) measure the loading times for the “main viewable element” of the page within the viewport, “layout distortions”, and “interactivity of the page” within different loading sequences, respectively.
In what follows, details of the above metrics and the recommended ways for optimization of the metrics are delved into. Pagespeed Insights measures these metrics in two different ways, namely, “in the lab” (data based on user experience simulation) and “in the field” (data on real user interactions). In this article, the “in the lab” scenario is considered for providing a checklist for optimization of each metric. In general, these checklists are utilized by optimization plugins in WordPress to optimize page load time by providing users access to customizable parameters.
LCP and its optimization procedure
What is LCP (Largest Contentful Paint)?
The standard definition as proposed by MDN for LCP is as follows: “The Largest Contentful Paint (LCP) performance metric provides the render time of the largest image or text block visible within the viewport, recorded from when the page first begins to load.” As per the definition, LCP is the time taken for display of the largest image or text content that is visible to the user in the viewport.
A standard has been developed by Google to measure the LCP score of webpages. They are as follows: (the color code can be seen in report generated by Pagespeed Insights)
a. Green — below 1.2 – acceptable score.
b. Orange — between 1.2 to 2.5 – needs improvement.
c. Red — more than 2.5 – poor LCP score.
Hereunder is provided a page speed calculator that is present in Lighthouse for calculating web speed. As can be seen from the calculator, LCP is in the “orange” range, showing that more improvement is possible in this area.
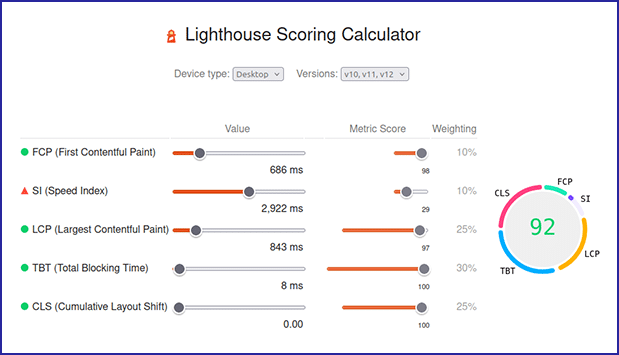
* Lighthouse Calculator Showing LCP
What does LCP measure?
As per definition, LCP measures the time taken to load the “largest element” of the page that is within the viewport. The largest element would be considered as one or more of the following elements.
a. Images (mainly banner images or sliders on page)
b. Video Elements – can appear usually on the top of the page or within the viewport.
c. Text Content – these would include block elements like section(s), div(s) or even paragraph(s).
d. Backgrounds – elements that load in the background, like images.
In all the above cases, the size of the element is the deciding factor for LCP.
However, the factors that can contribute to an increased LCP can be broadly termed as the following:
a. Resource load time – Loading time of the resources on the page.
b. Blocking resources – As a direct consequence of the above, there are some resources that block the page load.
c. Rendering the page on the browser – this includes the page elements and their loading times.
Usually, optimization procedures for LCP mainly look into the above 3 segments. These can be termed checklists for the optimization process for LCP.
Optimization of LCP
This section discusses a checklist that could be used to check for optimized LCP on the web pages based on the 3 criteria provided above.
a. Making Resources Load Faster
Resource load times can be affected by server response time. It is recommended to use a CDN to load assets for the page, which can comprise javascripts, styles, images, and videos, to name some. CDN (content delivery network) mainly has load balancing features embedded that can balance the response times during heavy and low traffic to a website. Further, CDNs also have embedded features to provide the optimized images for the pages as per the page requirement, thus reducing LCP.
If not using a CDN, developers can also utilize caching on the server to decrease LCP. Caching refers to storage on the server end for the static assets of a page. Caching can also be done at the browser end for pages that the user visits. Both the above caching methods reduce the resource loading time by not reconstructing the page on revisit.
Further, as LCP mainly depends on the content that is loading within the viewport, a review should be done on the image size if a page has images as the LCP. Hence, mentioning the image sizes and preloading images could be some options to consider. Also, there are various image optimizers that can be used to optimize the images. Moreover, image type also plays a role in resource loading due to size. For example, a “webp” type image has a much smaller size than a “png” image and hence loads quicker.
b. Making Resources Unblocking
Blocking page load while loading resources contributes to higher load times. Blocking resources mainly notifies the scenario where the page does not load other resources while the browser waits for a particular resource to load. In this context, features like minification of resources and using lazy loading of non-critical resources would be very helpful. Minification refers to the compression of the resources to reduce their sizes, and lazy loading refers to delaying loading of non-critical resources (resources that are not required for the essential components of the page to load).
Here, mention could be made of the attribute “loading” with the value of “eager” that can be used for main LCP images to load earlier than the other images that might be outside of the viewport or may be hidden altogether.
c. Browser Page Render
Browser Page Render gives better LCP value depending on how quickly the main component of the page loads and displays to the user. It could be useful to compress the HTML of the page as well so the full page loads faster. Further, CSS and JavaScript can be blocking resources. Hence, CSS can be preloaded so they are available to the browser when required, whereas Javascript can be “deferred” as the resource that will come into play when the elements of the page have finished loading.
CLS and its optimization procedure
What is CLS (Cumulative Layout Shift)?
A standard definition of Layout Shift is provided in the definition given by MDN: “It measures the extent to which users encounter unexpected layout shifts, in which elements of the page are moved in an unexpected way – that is, that are not the result of a user action like pressing a button or part of an animation.”
CLS that might cause elements to shift from their places or intermittent elements can suddenly pop-in, thus disrupting user experiences. In such cases, users can become confused and can take actions that were not intended.
A standard has been developed by Google to measure the CLS score of the webpages. They are as follows (the color code is as shown by Pagespeed Insights):
a. Green – below 0.1 – acceptable score
b. Orange – between 0.1 to 0.25 – needs improvement
c. Red – more than 0.25 – poor CLS score
Hereunder is provided a Lighthouse calculator that shows the calculation for CLS.

* Lighthouse Calculator Showing CLS
a. Rendering a font that is different than the initial font after the page load happens
b. Images that load with different dimensions
c. Sections that include dynamic content that resize as page load occurs
How can CLS be reduced?
Hereby, a suggestive checklist that can be used to reduce CLS on web pages has been provided. They define the segments that need to be reviewed to keep CLS in the “good” range. The segments are directly reciprocal to the causes of the CLS issues mentioned above.
a. Defining images, iframes or embeds with their dimensions
Images (iframes, embeds) would need to have their width and height defined so that the rendering element can display the above content in the width and height that had been specified in the “img” tag. This would avoid sudden layout changes when the image loads. Also, in the case of responsive images, the “img” tag can be defined to have a “srcset” attribute that can be used to define the responsive images for the different viewport dimensions.
Further, images can be “preloaded” to further enhance the website load experience and reduce layout shift. Preloaded images are available to the browsers when the page loads, so that significantly helps in reducing layout shifts.
b. Using custom web font load
Custom web fonts can alter the display when the custom font loads and hence can create high CLS values in the result. It is recommended to “preload” the font as well as use “swap”, as the “font-display” value will ensure that the font gets loaded and swapped correctly as the web page loads. This will reduce the layout shifts that might occur due to web font load.
C. Dynamic content loading
In the modern era, as dynamic content on web pages is quite common, optimization for this segment would be very important if the CLS score is to be kept low. Dynamic content is generally inserted via scripts when the web page loads. However, content could be optimized using the following suggestive techniques so that the CLS score would remain low.
- Using a fixed-width container for loading dynamic content: Since CLS deals with layout shift, using a fixed-width container to load the dynamic content is a safe way to avoid any layout shift as the dynamic content loads within the container. Also, there could be an initial image that is replaced within the container as the dynamic content loads.
- Using off-screen loading: Since CLS mainly deals with the section of the page within the viewport, off-screen loading of segments can be utilized to avoid any CLS value upsurge as the full page comes into view. Off-screen loading can continue when the page within the viewport has finished loading, thus reducing or avoiding any layout shift as the page loads completely.
- Layout or page content changes to be initiated by users: Since CLS deals with the page when it loads, using an action button to load dynamic content would not spike any CLS value. Hence, when the page has loaded, users can be prompted to load various segments depending on the application, so that the CLS value would remain optimal.
INP and its optimization procedure
The standard definition of INP as given by Google is as follows:
“INP is a metric that assesses a page’s overall responsiveness to user interactions by observing the latency of all click, tap, and keyboard interactions that occur throughout the lifespan of a user’s visit to a page.”
Usually, in the lab scenario, INP is similar to TBT usually encountered during the LCP phase of optimization. However, on consideration of real user data or field data, INP could be different. We hereby consider only “in lab tests”, and hence it suffices to say that optimization of LCP would in turn optimize INP.
WordPress CMS Optimization based on Core Web-Vitals metrics
This section looks into various ways expert WordPress developers can optimize “Core Web Vitals” metrics for WordPress and related content management systems. WordPress sites are usually optimized via optimization plugins like W3C Total Cache, WP-Rocket, WP-Optimize to name a few. However, while performing optimization via plugins the “Core Web Vitals” are optimized in turn by the plugins behind the scenes. We discuss here mainly how the different metrics are optimized by the above plugins.
There are different ways in which LCP is optimized for WordPress. Using the above plugins, users are able to use CDNs like Cloudflare, Stackpath, EWWW and the like. These CDNs have the features of asset optimization and load balancing mentioned earlier. Also, resources like images can be optimized by CDNs that use image optimizers to optimize images to formats that have smaller file sizes but mostly keep the aspect ratio intact. This helps in quicker loading. Further, there are plugins called Autooptimize that can be used to minimize resources, leading to lesser blocking times and hence faster loading times. These procedures implied in WordPress optimize LCP by resource optimization and loading.
CLS can be optimized for WordPress using different ways. WordPress has currently allowed ways in which programmers can defer scripts that are allowed on WordPress pages so that the layout shifts can be minimal. Further, the optimization plugins mentioned above reduce the amount of assets (mainly CSS) that will load on a particular page so that the layout shift is minimal while the page loads.
INP, which relates more to TBT mentioned earlier as per lab statistic, is reduced using the optimization plugins above, which work by minimization and lazy loading of the assets “below the fold” (area outside viewport) so that the page loads quicker and becomes available for user interactions like “scrolls and clicks”. All these methods, when utilized by the plugins, will speed up the loading time of a page by loading minimal assets required with minimal or no layout shifts.
How can Core-Web-Vitals be measured while development?
Google has provided a library that can be used to determine the values of “Core Web Vitals” metrics during development as well. Developers can view the respective values of the above metrics during development, giving them a guide and helping them write code that conforms to keeping the values of the metrics minimal, thus enhancing the user experience.
You May Also Read: The Next-Level of WordPress Performance Optimization with React-Powered Widgets
Conclusion
In the above discussion, three different but quite important metrics have been talked about. These three metrics are better known as “Core Web Vitals” that provide numerical figures for optimization of a web page, which can be used as markers for further optimization. These can be used during the time of development so as to write code that enhances the user experience. Details of these metrics and the recommended ways of optimization have been provided, leading to faster loading times and a better user experience. Further, utilization of these principles on WordPress has been discussed via WordPress plugins for faster page interactivity and loading times.

