

Power BI for Business Intelligence: Transforming Data into Insights
Table of Contents
In today’s fast-paced business environment, the ability to transform raw data into actionable insights is a key factor in maintaining a competitive edge. Companies generate vast amounts of data, but without the right tools to analyze and interpret this data, it remains an untapped resource. Microsoft Power BI is one of the leading tools that helps businesses unlock the potential of their data.
In this blog, we’ll explore how Power BI aids in turning data into valuable insights, why business intelligence is essential, and how to overcome the common challenges in data management.
The Necessity of Business Intelligence
As organizations continue to grow and adapt in the digital age, data has become one of their most valuable assets. From tracking customer behavior to monitoring internal processes, data is essential for informed decision-making. However, having data alone is not sufficient; it must be properly analyzed and interpreted to derive actionable insights. This is where Business Intelligence (BI) comes in.
Business Intelligence (BI) refers to the processes, technologies, and tools that help organizations collect, store, analyze, and present data to drive better business decisions. Power BI, a leading tool in this domain, provides organizations with the ability to:
- Consolidate Data: Aggregate data from multiple sources into a single platform for a unified analysis.
- Visualize Data: Convert complex datasets into user-friendly visualizations that are easy to interpret.
- Identify Trends: Discover patterns and trends within the data that inform strategic planning.
- Enhance Decision-Making: Provide real-time insights that lead to quicker, more informed decisions.
- Foster Collaboration: Share insights across the organization to build a data-driven culture.
The Problem: Challenges in Transforming Data into Insights
Despite the clear benefits of BI, many organizations struggle with effectively utilizing their data. Common challenges include:
- Data Silos: Data is often stored in different systems or departments, making it difficult to get a complete view.
- Data Complexity: Large, complex data sets can be overwhelming without the right analytical tools.
- Limited Data Literacy: Not all employees have the expertise to interpret data effectively, which can lead to missed opportunities.
- Manual Processes: Traditional data collection and analysis methods are often slow, leading to delays in decision-making.
- Difficulty in Identifying Key Insights: With so much data available, it can be challenging to focus on the most important information.
These challenges can prevent businesses from fully leveraging their data, which can lead to suboptimal decisions and missed opportunities for growth.
You May Also Read: Mastering the Art of Data Storytelling: A Complete Guide
The Solution: How Power BI Transforms Data into Insights
Power BI addresses these challenges by providing a comprehensive, user-friendly platform that makes business intelligence accessible to everyone in the organization. Here’s how Power BI transforms data into actionable insights:
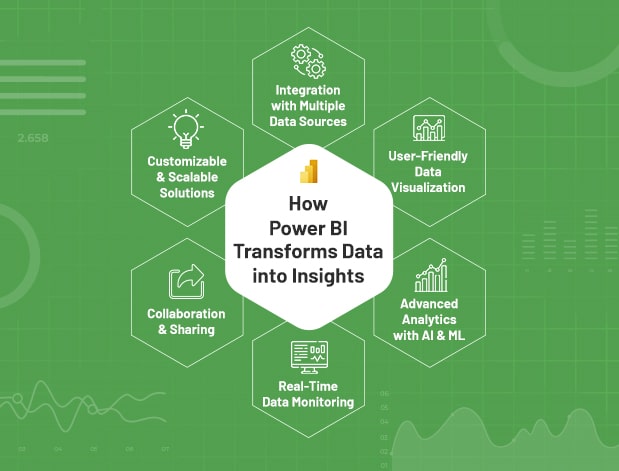
1. Integration with Multiple Data Sources
One of the most significant advantages of Power BI is its ability to integrate data from various sources. Whether your data is stored on-premises or in the cloud, Power BI can connect to it. This integration capability helps break down data silos, allowing for a more comprehensive analysis of business operations.
For example, a retail company might use Power BI to combine data from its in-store sales systems, online platforms, and customer service records. By analyzing this combined data, the company can gain a clearer understanding of customer behavior and make more informed decisions about inventory management, marketing strategies, and customer service improvements.
2. User-Friendly Data Visualization
Power BI is designed with the user in mind, offering a range of data visualization tools that make it easy to present data in a clear and engaging way. Users can create custom dashboards and reports using a simple drag-and-drop interface, allowing them to explore data in various formats, such as bar charts, line graphs, and maps.
For instance, a sales manager could create a dashboard in Power BI to track sales performance across different regions. By visualizing this data, the manager can quickly identify high-performing areas and adjust strategies to address underperforming ones. The ability to visualize data in a meaningful way is crucial for making informed decisions quickly and efficiently.
3. Advanced Analytics with AI and Machine Learning
Power BI incorporates advanced analytics features powered by AI and machine learning, enabling businesses to uncover deeper insights and make data-driven predictions. These capabilities allow users to perform tasks such as trend analysis, predictive modeling, and sentiment analysis, all within the Power BI platform.
For example, a marketing team could use Power BI to analyze customer sentiment on social media, predict future buying behaviors, and adjust their campaigns accordingly. By leveraging AI and machine learning, businesses can stay ahead of trends and make proactive decisions that drive growth.
4. Real-Time Data Monitoring
In industries where timing is critical, having access to real-time data is essential. Power BI supports real-time data streaming, allowing businesses to monitor key metrics as they happen. This feature is particularly useful in sectors like finance, manufacturing, and retail, where immediate actions can have significant impacts.
For example, a financial services firm might use Power BI to monitor real-time market data. By setting up alerts for specific conditions, the firm can respond quickly to market fluctuations, ensuring they capitalize on opportunities or mitigate risks in a timely manner.
5. Collaboration and Sharing
Power BI’s collaborative features make it easy for teams to share insights and work together on data analysis. Reports and dashboards can be published to the Power BI service, where they are accessible to anyone within the organization with the appropriate permissions. This shared access ensures that everyone is on the same page and that insights are used effectively across the business.
Furthermore, Power BI integrates seamlessly with other Microsoft products like Teams and SharePoint, creating a collaborative environment where data-driven discussions can take place. This fosters a culture of collaboration and ensures that data is leveraged effectively to support decision-making.
6. Customizable and Scalable Solutions
Power BI offers a high degree of customization, allowing businesses to tailor dashboards, reports, and data models to their specific needs. This flexibility is crucial for organizations with unique requirements or those looking to address specific challenges. Additionally, Power BI is scalable, making it suitable for small businesses and large enterprises alike.
Whether you’re a startup looking to make sense of your customer data or a multinational corporation needing to monitor global operations, Power BI can scale to meet your needs. Its customizable features ensure that you can build the tools and visualizations that are most relevant to your business goals.
Turn your data into actionable insights with our Power BI development services. Contact us today.
Conclusion: Leveraging Power BI for Business Growth
Power BI is more than just a data visualization tool; it’s a comprehensive business intelligence platform that empowers organizations to turn data into actionable insights. By addressing common data management challenges and providing a user-friendly interface, Power BI enables businesses to make informed decisions that drive growth.
To fully leverage the power of Power BI, businesses should:
- Integrate Data Sources: Connect all relevant data sources to Power BI for a unified view of your business.
- Invest in Training: Ensure your team has the skills needed to use Power BI effectively, particularly in areas like data visualization and advanced analytics.
- Promote a Data-Driven Culture: Encourage the use of data in decision-making at all levels of the organization.
- Utilize Advanced Analytics: Take advantage of Power BI’s AI and machine learning features to gain deeper insights and stay ahead of trends.
- Monitor Data in Real-Time: Use Power BI’s real-time data capabilities to remain agile and responsive in a dynamic business environment.
By following these steps, organizations can unlock the full potential of their data, transforming it into a strategic asset that drives sustained growth and success. In a world where data is increasingly central to business strategy, Power BI provides the tools needed to stay ahead of the competition and achieve your business goals.

![]()